Overview
The dashboards in Manufacton have been designed to provide critical information regarding material and production progress and effectiveness.
There are several sets of dashboards available within the system including:
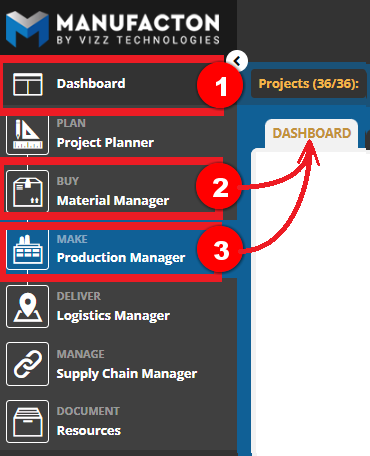
- The High-level Executive Dashboard Module
- The Material Manager Dashboard sub-tab
- The Production Manager Dashboard sub-tab
Each contains several "at-a-glance" dashboards that provide Executives and Managers a sense of how things are going in various parts of their enterprise.
Leveraging Dashboard Data
The dashboards within Manufacton are updated up to 48 times per day (~2 times/hour). At the top-right of several of the dashboards is an indicator of when the dashboard was last updated.

All of the dashboards are responsive to the projects which are currently in focus via the Project Filter. To focus on one, a few or all projects, first set the Project filter.

Most of the elements in the dashboards are "responsive", meaning that selecting an element in the dashboard will either take you to a list view of the data that makes up that data set or further filters the dashboard to include only data from the selected element.
Overall, there are seven (7) dashboards available across the three areas in which they are displayed:
- Order Summary
- Vendor Delivery Performance
- Shop Hours
- Productivity by Project
- Productivity by Work Step
- Material Orders by Project
- Material Requests by User
Order Summary

This dashboard provides a high-level view of the number of Material, Production and Shipping Orders which are:
- Overdue
- Due within a week
- Due between 1-6 weeks
Selecting any of the numeric values near the top of each section will bring you to a list view of the orders that make up that data set.
Vendor Delivery Performance

This dashboard provides a visual of how well your vendors are supplying you with your material orders:
- Pending = Unfulfilled orders which are still tracking as on time
- Late = Unfulfilled orders which are already late
- Delivered On Time= Received orders which were delivered on time
- Delivered Late = Received orders which were delivered late
Selecting any of the numeric values near the top of each section will bring you to a list view of the orders that make up that data set.
By toggling the selector in the top right-hand corner this dashboard can be set to show data from:
- All time
- The Past Week
- The Past Month
- The Past 3 Months
- The Past Year
Shop Hours

This dashboard provides both the number of Production Orders and the number of planned and actual hours performed on those orders for the current Month (or week) and looking forward four additional time periods.
On the left side of the dashboard, for "Total Orders", "Manufacturing Status" and "Order Stage" a count of orders whose Manufacture by date is within the next several weeks/months is provided.
Selecting the numeric value near the top will bring you to a list view of the orders that make up that data set.
On the right side of the dashboard, the "Shop Hours by Month/Week" provides the number of planned and actual hours for those production orders. Only the current week will show any "actual hours" spent while the remaining weeks/months will distribute the planned hours based on each order's Detail by and Manufacture by dates.
By toggling the selector in the top right-hand corner this dashboard can be set to show data for the next four:
- Months
- Weeks
Productivity by Project

This dashboard provides detailed information with regard to how well each project is performing with respect to planned v actual hours on a project-by-project basis.
Productivity is calculated by the following formula:
(Actual Hours / Planned Hours) / (Percent Complete)
A value of:
1 = on track
>1 = behind plan
<1 = ahead of plan
The coloring is also an indicator of productivity:
Green = Productivity Factor is less than or equal to 1
Yellow = Productivity Factor is greater than 1 but less than 1.25
Red = Productivity Factor is greater than 1.25
Selecting any of the numeric values will bring you to a list view of the orders that make up that data set.
Productivity by Work Step
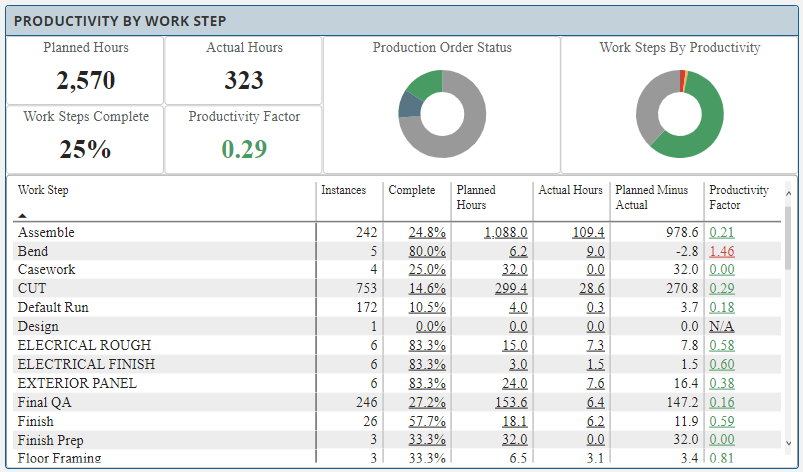
This dashboard provides detailed information with regard to how well each project is performing with respect to planned v actual hours on a work step by work step basis.
Selecting any of the numeric values will bring you to a list view of the orders that make up that data set.
Material Orders by Project

This dashboard provides information on how much and how well each project is being supplied with their necessary materials.
By toggling the selector in the top right-hand corner this dashboard can be set to show data from:
- All time
- The Past Week
- The Past Month
- The Past 3 Months
- The Past Year
Selecting any of the numeric values will bring you to a list view of the orders that make up that data set.
Material Request by User

This dashboard provides insights into how much lead time each project team member is providing the procurement team for Material Orders.
By toggling the selector in the top right-hand corner this dashboard can be set to show data from:
- All time
- The Past Week
- The Past Month
- The Past 3 Months
- The Past Year
Selecting any of the numeric values will bring you to a list view of the orders that make up that data set.
Comments
0 comments
Please sign in to leave a comment.